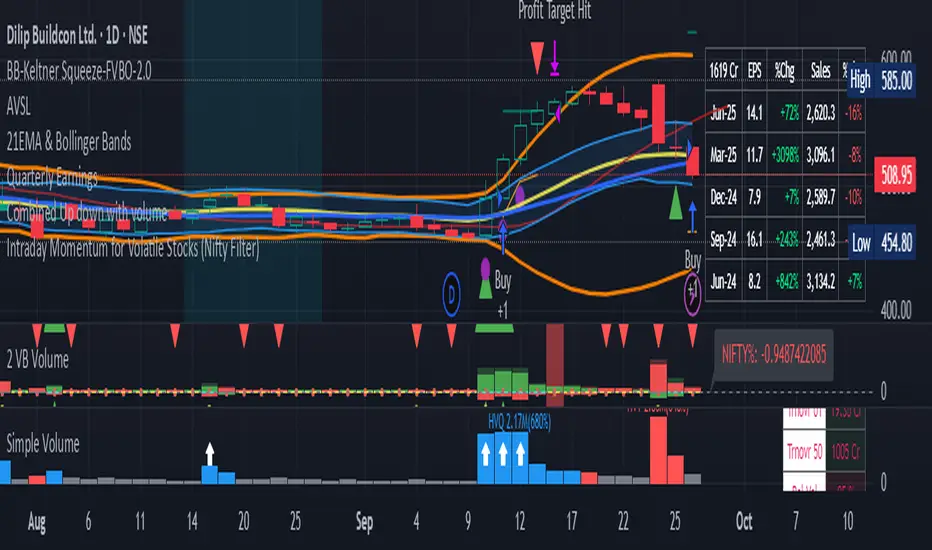
NY First Candle Break and RetestStrategy Overview
Session and Time Parameters:
The strategy focuses on the New York trading session, starting at 9:30 AM and lasting for a predefined session length, typically 3 to 4 hours. This timing captures the most active market hours, providing ample trading opportunities.
Strategy Parameters:
Utilizes the Average True Range (ATR) to set dynamic stop-loss levels, ensuring risk is managed according to market volatility.
Employs a reward-to-risk ratio to determine take profit levels, aiming for a balanced approach between potential gains and losses.
Strategy Settings:
Incorporates simple moving averages (EMA) and the Volume Weighted Average Price (VWAP) to identify trend direction and price levels.
Volume confirmation is used to validate breakouts, ensuring trades are based on significant market activity.
Trade Management:
Features a trailing stop mechanism to lock in profits as the trade moves in favor, with multiple take profit levels to secure gains incrementally.
The strategy is designed to handle both long and short positions, adapting to market conditions.
Alert Settings:
Provides alerts for key events such as session start, breakout, retest, and entry signals, helping traders stay informed and act promptly.
Visual cues on the chart highlight entry and exit points, making it easier for beginners to follow the strategy.
This strategy is particularly suited for the current volatile market environment, where simplicity and clear guidelines can help beginner traders navigate the complexities of trading. It emphasizes risk management and uses straightforward indicators to make informed trading decisions.
I put together this Trading View scalping strategy for futures markets with some help from Claude AI. Shoutout to everyone who gave me advice along the way—I really appreciate it! I’m sure there’s room for improvement, so feel free to share your thoughts… just go easy on me. :)
Komut dosyalarını "stop loss" için ara
Scalping 15min: EMA + MACD + RSI + ATR-based SL/TP📈 Strategy: 15-Minute Scalping — EMA + MACD + RSI + ATR-based SL/TP
This scalping strategy is designed for 15-minute charts and combines trend-following and momentum confirmation with dynamic stop loss and take profit levels based on volatility.
🔧 Indicators Used:
EMA 50 — identifies the main trend
MACD Histogram — confirms momentum direction
RSI (14) — filters overbought/oversold conditions
ATR (14) — dynamically sets SL and TP based on market volatility
📊 Entry Conditions:
Long Entry:
Price is above EMA 50
MACD histogram is positive
RSI is above 50 but below 70
Short Entry:
Price is below EMA 50
MACD histogram is negative
RSI is below 50 but above 30
🛑 Risk Management:
Stop Loss: 1×ATR (user-configurable)
Take Profit: 2×ATR (user-configurable)
These values can be adjusted in the script inputs depending on your risk/reward preference or market conditions.
⚠️ Notes:
Strategy is optimized for scalping fast-moving pairs (e.g. crypto, forex).
Works best in trending markets.
Use backtesting and forward testing before live trading.
Smart Grid Scalping (Pullback) Strategy[BullByte]The Smart Grid Scalping (Pullback) Strategy is a high-frequency trading strategy designed for short-term traders who seek to capitalize on market pullbacks. This strategy utilizes a dynamic ATR-based grid system to define optimal entry points, ensuring precise trade execution. It integrates volatility filtering and an RSI-based confirmation mechanism to enhance signal accuracy and reduce false entries.
This strategy is specifically optimized for scalping by dynamically adjusting trade levels based on current market conditions. The grid-based system helps capture retracement opportunities while maintaining strict trade management through predefined profit targets and trailing stop-loss mechanisms.
Key Features :
1. ATR-Based Grid System :
- Uses a 10-period ATR to dynamically calculate grid levels for entry points.
- Prevents chasing trades by ensuring price has reached key levels before executing entries.
2. No Trade Zone Protection :
- Avoids low-volatility zones where price action is indecisive.
- Ensures only high-momentum trades are executed to improve success rate.
3. RSI-Based Entry Confirmation :
- Long trades are triggered when RSI is below 30 (oversold) and price is in the lower grid zone.
- Short trades are triggered when RSI is above 70 (overbought) and price is in the upper grid zone.
4. Automated Trade Execution :
- Long Entry: Triggered when price drops below the first grid level with sufficient volatility.
- Short Entry: Triggered when price exceeds the highest grid level with sufficient volatility.
5. Take Profit & Trailing Stop :
- Profit target set at a customizable percentage (default 0.2%).
- Adaptive trailing stop mechanism using ATR to lock in profits while minimizing premature exits.
6. Visual Trade Annotations :
- Clearly labeled "LONG" and "SHORT" markers appear at trade entries for better visualization.
- Grid levels are plotted dynamically to aid decision-making.
Strategy Logic :
- The script first calculates the ATR-based grid levels and ensures price action has sufficient volatility before allowing trades.
- An additional RSI filter is used to ensure trades are taken at ideal market conditions.
- Once a trade is executed, the script implements a trailing stop and predefined take profit to maximize gains while reducing risks.
---
Disclaimer :
Risk Warning :
This strategy is provided for educational and informational purposes only. Trading involves significant risk, and past performance is not indicative of future results. Users are advised to conduct their own due diligence and risk management before using this strategy in live trading.
The developer and publisher of this script are not responsible for any financial losses incurred by the use of this strategy. Market conditions, slippage, and execution quality can affect real-world trading outcomes.
Use this script at your own discretion and always trade responsibly.
AsianRange&Midnight 2.2### Midnight Setup: Trading Strategy
#### **Bias Definition (Trend Identification)**
- The Daily (D) bias is defined the previous day and validated on the line chart.
- On the Daily chart, identify the nearest V-shaped formation that has broken close to the current price. This formation determines the Daily bias direction.
#### **H4 Bias Analysis (Trend Confirmation)**
- Switch to an H4 chart to refine the analysis.
- Identify a similar V-shaped formation that has broken in the H4 timeframe.
- If the Daily and H4 biases are aligned, the setup is valid.
#### **Entry Strategy (Position Entries)**
- **Bearish Bias (D and H4 identical):**
- Short entry at the high level of the Midnight range.
- **Bullish Bias (D and H4 identical):**
- Long entry at the low level of the Midnight range.
#### **Bias Divergence (Context Adaptation)**
- If the H4 bias is opposite to the Daily bias, this indicates an H4 retracement of the Daily bias.
- Enter a counter-trend trade with reduced risk.
- No TP target beyond 50% of the extension validating the Daily break. It is also not recommended to enter against this divergence beyond 50%.
#### **Divergence Scenarios (Reactions to Divergences)**
- **Daily Bearish Bias, H4 Bullish Bias:**
- Long entry at the Midnight Low.
- **Daily Bullish Bias, H4 Bearish Bias:**
- Short entry at the Midnight High.
#### **Daily Bias Resumption (Trend Alignment)**
- As soon as the H4 bias resumes the Daily bias direction, follow this trend and adjust the position accordingly.
#### **Instructions for Divergent Bias (Managing Divergence)**
- When holding a position with a divergent bias, it is crucial to manage it carefully.
- Exit counter-trend trades as soon as the H4 bias realigns with the Daily bias.
- Limit the duration of counter-trend trades per session and adjust the H4 bias for the next session if needed.
#### **SL/TP Management (Profit Taking and Protection Optimization)**
- **Take Profit (TP):**
- Entry in M15 with a minimum RR of 3.
- TP at 5H NYE, or RR 5, or 15H NYE.
- **Stop Loss (SL):**
- Minimum 15 pips, placed just above the nearest swing to the entry point to protect capital.
- **Red Announcement Days:**
- Either abstain from trading or set a 40-pip SL to limit volatility impact.
- **At 6H/7H NYE:**
- Manage the trade based on its progress: exit, set to BE (Break Even), or keep the SL in place.
- Any SL adjustment outside these rules can only be made if supported by data or backtests.
#### **Risk Management (Capital Protection)**
- Maximum risk of **1% of capital per trade** (allowing for **10 consecutive losses** without significantly affecting capital).
- In case of a loss, **reduce risk by 50% on the next trade** until the loss is recovered.
#### **Efficiency Conditions (When This Setup Works Best)**
- This setup is particularly effective in **strong trends**, where the market has a clear direction.
- It is **less effective in ranging markets**, where prices move within a narrow range without a clear trend.
Setup Midnight : Stratégie de Trading
Market Push Meter - CoffeeStyleMarket Push Meter - CoffeeKiller Indicator Guide
Welcome traders! This guide will walk you through the Market Push Meter indicator, a sophisticated volume analysis tool developed by CoffeeKiller with the help and assistance of FindBetterTrades that measures and visualizes the ongoing battle between buyers and sellers through volume pressure analysis.
🔔 **Warning: This Is Not a Standard Volume Indicator** 🔔 This indicator analyzes volume pressure in a unique way, combining directional volume with price action to identify market imbalances between buyers and sellers. All credit for the core logic for this indicator goes to FindBetterTrades and his/hers Volume Pressure Histogram (Normalized) (this is my adaptation and style added to that core logic, thus the CoffeeStyle name was added).
Core Concept: Volume Pressure Analysis
The foundation of this indicator lies in measuring the imbalance between buying and selling volume, providing insights into which market participants are exerting more pressure on price movements.
Volume Pressure Columns: Buying vs Selling Force
- Positive Green Columns: Net buying pressure
- Negative Red Columns: Net selling pressure
- Color intensity varies based on pressure strength
- Special coloring for new high/low boundaries
Marker Lines: Dynamic Support/Resistance
- High Marker Line (Magenta): Tracks the highest point reached during buying phases
- Low Marker Line (Cyan): Tracks the lowest point reached during selling phases
- Creates visual boundaries showing pressure extremes
Peak Detection System:
- Triangular markers identify significant local maxima and minima
- Background highlighting shows important pressure peaks
- Helps identify potential reversal points and pressure exhaustion
Reference Lines:
- Overbought Level: Threshold for extreme selling pressure
- Oversold Level: Threshold for extreme buying pressure
- Used to identify potential reversal zones
Core Components
1. Volume Pressure Calculation
- Separation of up-volume and down-volume
- Calculation of net volume pressure
- Smoothing for consistent visualization
- Normalization against total volume for percentage scaling
2. Boundary Tracking System
- Automatic detection of highest values in buying phases
- Automatic detection of lowest values in selling phases
- Step-line visualization of boundaries
- Color-coded for easy identification
3. Peak Detection System
- Identification of local maxima and minima
- Background highlighting of significant peaks
- Triangle markers for peak visualization
- Zero-line cross detection for trend changes
4. Threshold Settings
- Extreme threshold multiplier for identifying significant pressure
- Overbought/oversold levels for potential reversals
- Dynamic color coding based on pressure intensity
- Alert conditions for key pressure levels
Main Features
Volume Analysis Settings
- Customizable volume MA length
- Signal smoothing for clearer readings
- Optional log scale for handling wide range variations
- Adjustable threshold multiplier for sensitivity
Visual Elements
- Color-coded columns showing pressure direction and strength
- Dynamic marker lines for pressure boundaries
- Peak triangles for significant turning points
- Background highlighting for peak identification
- Overbought/oversold reference lines
Signal Generation
- Zero-line crosses for trend change signals
- Boundary breaks for pressure strength
- Peak formation for potential reversals
- Color changes for pressure direction and intensity
- Alert conditions for extreme pressure levels
Customization Options
- Volume analysis parameters
- Marker line visibility and colors
- Peak marker display options
- Log scale toggle for handling various markets
- Overbought/oversold threshold adjustments
Trading Applications
1. Trend Identification
- Volume pressure crossing above zero: buying pressure emerging
- Volume pressure crossing below zero: selling pressure emerging
- Column color: indicates pressure direction
- Column height: indicates pressure strength
- Signal line: confirms overall trend direction
2. Reversal Detection
- Peak triangles after extended trend: potential exhaustion
- Background highlighting: significant reversal points
- Volume pressure approaching marker lines: potential trend change
- Color shifts from bright to muted: decreasing pressure
- Readings beyond overbought/oversold levels: potential reversal zones
3. Pressure Analysis
- Breaking above previous high boundary: accelerating buying pressure
- Breaking below previous low boundary: accelerating selling pressure
- Special coloring (magenta/cyan): boundary breaks indicating strength
- Extreme readings: potential climactic buying/selling
4. Market Structure Assessment
- Consecutive higher peaks: strengthening buying structure
- Consecutive lower troughs: strengthening selling structure
- Peak comparisons: relative strength of pressure phases
- Boundary line steps: market structure levels
Optimization Guide
1. Volume Analysis Settings
- Volume MA Length: Default 25 provides balanced signals
- Lower values (10-15): More responsive, potentially noisier
- Higher values (30-50): Smoother, fewer false signals
- Signal Smoothing Length: Default 8 provides good balance
- Lower values: More responsive to pressure changes
- Higher values: Smoother trend identification
2. Threshold Settings
- Extreme Threshold Multiplier: Default 20.0
- Lower values: More signals, potentially more noise
- Higher values: Fewer signals, but more significant
- Overbought/Oversold Levels: Defaults at 20/-20
- Adjust based on instrument volatility
- Wider settings for more volatile instruments
3. Visual Customization
- Marker Line Colors: Adjust for visibility on your chart
- Peak Marker Color: Default yellow provides good contrast
- Enable/disable background highlights based on preference
- Consider log scale for instruments with wide volume ranges
4. Alert Settings
- Configure alerts for high buying pressure
- Configure alerts for high selling pressure
- Set additional alerts for zero-line crosses
- Consider timeframe when setting alert sensitivity
Best Practices
1. Signal Confirmation
- Wait for zero-line crosses to confirm pressure changes
- Look for peak formations to identify potential reversals
- Check for boundary breaks to confirm strong pressure
- Use with price action for entry/exit precision
- Consider extreme threshold crossings as significant signals
2. Timeframe Selection
- Lower timeframes: more signals, potential noise
- Higher timeframes: cleaner signals, less frequent
- Multiple timeframes: confirm signals across time horizons
- Match to your trading style and holding period
3. Market Context
- Strong buying phase: positive columns breaking above marker line
- Strong selling phase: negative columns breaking below marker line
- Columns approaching zero: potential pressure shift
- Columns beyond overbought/oversold: extreme conditions, potential reversal
4. Combining with Other Indicators
- Use with trend indicators for confirmation
- Pair with price action oscillators for divergence detection
- Combine with traditional volume indicators for validation
- Consider support/resistance levels with boundary lines
Advanced Trading Strategies
1. Boundary Break Strategy
- Enter long when volume pressure breaks above previous high marker line
- Enter short when volume pressure breaks below previous low marker line
- Use zero-line as initial stop-loss reference
- Take profits at formation of opposing peaks
2. Peak Trading Strategy
- Identify significant peaks with triangular markers
- Look for consecutive lower peaks in buying phases for shorting opportunities
- Look for consecutive higher troughs in selling phases for buying opportunities
- Use zero-line crosses as confirmation
3. Extreme Reading Strategy
- Look for volume pressure beyond overbought/oversold levels
- Watch for color changes and peak formations
- Enter counter-trend positions after confirmed peaks
- Use tight stops due to extreme market conditions
4. Volume Color Strategy
- Enter long when columns turn bright green (increasing buying pressure)
- Enter short when columns turn bright red (increasing selling pressure)
- Exit when color intensity fades (decreasing pressure)
- Use marker lines as dynamic support/resistance
Practical Analysis Examples
Bullish Market Scenario
- Volume pressure crosses above zero line
- Green columns grow in height and intensity
- High marker line forms steps upward
- Peak triangles appear at local maxima
- Background highlights appear at significant buying pressure peaks
Bearish Market Scenario
- Volume pressure crosses below zero line
- Red columns grow in depth and intensity
- Low marker line forms steps downward
- Peak triangles appear at local minima
- Background highlights appear at significant selling pressure troughs
Consolidation Scenario
- Volume pressure oscillates around zero line
- Column colors alternate frequently
- Marker lines remain relatively flat
- Few or no new peak highlights appear
- Pressure values remain small
Understanding Market Dynamics Through Market Push Meter
At its core, this indicator provides a unique lens to visualize market pressure through volume analysis:
1. Volume Imbalance: By separating and comparing buying volume (up candles) from selling volume (down candles), the indicator provides insights into which side is exerting more pressure in the market.
2. Normalized Pressure: The indicator normalizes volume pressure as a percentage of total volume, making it more comparable across different market conditions and instruments.
3. Dynamic Boundaries: The marker lines create a visual representation of the "high water marks" of pressure in both directions, helping to identify when markets are making new pressure extremes.
4. Exhaustion Signals: The peak detection system highlights moments where pressure has reached a local maximum or minimum, often precursors to reversals or consolidations.
Remember:
- Combine signals from volume pressure, marker lines, and peak formations
- Use appropriate timeframe settings for your trading style
- Customize the indicator to match your visual preferences and market
- Consider overall market conditions and correlate with price action
This indicator works best when:
- Used as part of a comprehensive trading system
- Combined with proper risk management
- Applied with an understanding of current market conditions
- Signals are confirmed by price action and other indicators
DISCLAIMER: This indicator and its signals are intended solely for educational and informational purposes. They do not constitute financial advice. Trading involves significant risk of loss. Always conduct your own analysis and consult with financial professionals before making trading decisions.
RSI + MFI Momentum Mapper - CoffeeKillerRSI + MFI Momentum Mapper - CoffeeKiller Indicator Guide
Welcome traders! This guide will walk you through the RSI + MFI Momentum Mapper indicator, an innovative market analysis tool developed by CoffeeKiller that combines two powerful oscillators to create a comprehensive momentum visualization system.
🔔 **Warning: This Is Not a Standard RSI or MFI Indicator** 🔔 This indicator combines and normalizes RSI and MFI data to create a unified momentum representation with boundary detection and peak signaling features.
Core Concept: Combined Momentum Analysis
The foundation of this indicator lies in merging the strengths of two complementary oscillators - Relative Strength Index (RSI) and Money Flow Index (MFI) - to provide a more robust momentum signal that accounts for both price action and volume.
Directional Columns: Momentum Strength
- Positive Green Columns: Bullish momentum
- Negative Red Columns: Bearish momentum
- Color intensity varies based on momentum strength
- Special coloring for new high/low boundaries
Marker Lines: Dynamic Support/Resistance
- High Marker Line (Magenta): Tracks the highest point reached during a bullish phase
- Low Marker Line (Cyan): Tracks the lowest point reached during a bearish phase
- Creates visual boundaries showing momentum extremes
Peak Detection System:
- Triangular markers identify significant local maxima and minima
- Background highlighting shows important momentum peaks
- Helps identify potential reversal points and momentum exhaustion
Reference Lines:
- Zero Line (Gray): Divides bullish from bearish momentum
- High Line (+1): Upper threshold for extremely bullish conditions
- Low Line (-1): Lower threshold for extremely bearish conditions
Core Components
1. Oscillator Normalization
- RSI and MFI values centered around zero
- Values scaled to create consistent visualization
- Normalized range typically between -1 and +1
- Combination of indicators for signal reliability
2. Boundary Tracking System
- Automatic detection of highest values in bullish phases
- Automatic detection of lowest values in bearish phases
- Step-line visualization of boundaries
- Color-coded for easy identification
3. Peak Detection System
- Identification of local maxima and minima
- Background highlighting of significant peaks
- Triangle markers for peak visualization
- Zero-line cross detection for trend changes
4. Signal Smoothing
- Signal line calculation via SMA
- Helps filter noise and identify trends
- Provides confirmation of momentum direction
Main Features
Oscillator Settings
- Customizable RSI length for sensitivity control
- Customizable MFI length for sensitivity control
- Normalized display for consistent visualization
- Signal smoothing for clearer readings
Visual Elements
- Color-coded columns showing momentum direction and strength
- Dynamic marker lines for momentum boundaries
- Peak triangles for significant turning points
- Background highlighting for peak identification
- Reference lines for momentum threshold levels
Signal Generation
- Zero-line crosses for trend change signals
- Boundary breaks for momentum strength
- Peak formation for potential reversals
- Color changes for momentum direction and acceleration
Customization Options
- RSI and MFI length parameters
- Marker line visibility and colors
- Peak marker color selection
- Peak background display options
Trading Applications
1. Trend Identification
- Directional line crossing above zero: bullish trend beginning
- Directional line crossing below zero: bearish trend beginning
- Column color: indicates momentum direction
- Column height: indicates momentum strength
2. Reversal Detection
- Peak triangles after extended trend: potential exhaustion
- Background highlighting: significant reversal points
- Directional line approaching marker lines: potential trend change
- Color shifts from bright to muted: decreasing momentum
3. Momentum Analysis
- Breaking above previous high boundary: accelerating bullish momentum
- Breaking below previous low boundary: accelerating bearish momentum
- Special coloring (magenta/cyan): boundary breaks indicating strength
- Approaching +1/-1 lines: extreme momentum conditions
4. Market Structure Assessment
- Consecutive higher peaks: strengthening bullish structure
- Consecutive lower troughs: strengthening bearish structure
- Peak comparisons: relative strength of momentum phases
- Boundary line steps: market structure levels
Optimization Guide
1. Oscillator Settings
- RSI Length: Default 14 provides balanced signals
- Lower values (7-10): More responsive, potentially noisier
- Higher values (20-30): Smoother, fewer false signals
- MFI Length: Default 14 provides balanced signals
- Lower values: More responsive to volume changes
- Higher values: Less sensitive to short-term volume spikes
2. Visual Customization
- Marker Line Colors: Adjust for visibility on your chart
- Peak Marker Color: Default yellow provides good contrast
- Enable/disable background highlights based on preference
- Consider chart background when selecting colors
3. Signal Interpretation
- Stronger signals: When directional line approaches +1/-1
- Confirmation: When peaks form after extended momentum
- Early warnings: When color intensity changes before direction
- Trend strength: Distance between zero line and current reading
4. Reference Line Usage
- Zero line: Primary trend divider
- +1/-1 lines: Extreme momentum thresholds
- Marker lines: Dynamic support/resistance levels
- Distance from reference: Momentum strength measure
Best Practices
1. Signal Confirmation
- Wait for zero-line crosses to confirm trend changes
- Look for peak formations to identify potential reversals
- Check for boundary breaks to confirm strong momentum
- Use with price action for entry/exit precision
2. Timeframe Selection
- Lower timeframes: more signals, potential noise
- Higher timeframes: cleaner signals, less frequent
- Multiple timeframes: confirm signals across time horizons
- Match to your trading style and holding period
3. Market Context
- Strong bullish phase: positive columns breaking above marker line
- Strong bearish phase: negative columns breaking below marker line
- Columns approaching zero: potential trend change
- Columns approaching +1/-1: extreme conditions, potential reversal
4. Combining with Other Indicators
- Use with trend indicators for confirmation
- Pair with other oscillators for divergence detection
- Combine with volume analysis for validation
- Consider support/resistance levels with boundary lines
Advanced Trading Strategies
1. Boundary Break Strategy
- Enter long when directional line breaks above previous high marker line
- Enter short when directional line breaks below previous low marker line
- Use zero-line as initial stop-loss reference
- Take profits at formation of opposing peaks
2. Peak Trading Strategy
- Identify significant peaks with triangular markers
- Look for consecutive lower peaks in bullish phases for shorting opportunities
- Look for consecutive higher troughs in bearish phases for buying opportunities
- Use zero-line crosses as confirmation
3. Extreme Reading Strategy
- Look for directional line approaching +1/-1 lines
- Watch for color changes and peak formations
- Enter counter-trend positions after confirmed peaks
- Use tight stops due to extreme momentum conditions
4. Column Color Strategy
- Enter long when columns turn bright green (increasing momentum)
- Enter short when columns turn bright red (increasing momentum)
- Exit when color intensity fades (decreasing momentum)
- Use marker lines as dynamic support/resistance
Practical Analysis Examples
Bullish Market Scenario
- Directional line crosses above zero line
- Green columns grow in height and intensity
- High marker line forms steps upward
- Peak triangles appear at local maxima
- Background highlights appear at significant momentum peaks
Bearish Market Scenario
- Directional line crosses below zero line
- Red columns grow in depth and intensity
- Low marker line forms steps downward
- Peak triangles appear at local minima
- Background highlights appear at significant momentum troughs
Consolidation Scenario
- Directional line oscillates around zero line
- Column colors alternate frequently
- Marker lines remain relatively flat
- Few or no new peak highlights appear
- Directional values remain small
Understanding Market Dynamics Through RSI + MFI Momentum Mapper
At its core, this indicator provides a unique lens to visualize market momentum by combining two complementary oscillators:
1. Combined Strength: By averaging RSI (price-based) and MFI (volume-based), the indicator provides a more comprehensive view of market momentum that considers both price action and buying/selling pressure.
2. Normalized Scale: The indicator normalizes values around zero, making it easier to identify bullish vs bearish conditions and the relative strength of momentum in either direction.
3. Dynamic Boundaries: The marker lines create a visual representation of the "high water marks" of momentum in both directions, helping to identify when markets are making new momentum extremes.
4. Exhaustion Signals: The peak detection system highlights moments where momentum has reached a local maximum or minimum, often precursors to reversals or consolidations.
Remember:
- Combine signals from directional line, marker lines, and peak formations
- Use appropriate timeframe settings for your trading style
- Customize the indicator to match your visual preferences
- Consider market conditions and correlate with price action
This indicator works best when:
- Used as part of a comprehensive trading system
- Combined with proper risk management
- Applied with an understanding of current market conditions
- Signals are confirmed by price action and other indicators
DISCLAIMER: This indicator and its signals are intended solely for educational and informational purposes. They do not constitute financial advice. Trading involves significant risk of loss. Always conduct your own analysis and consult with financial professionals before making trading decisions.
Alpha Wave System @DaviddTechAlpha Wave DaviddTech System by DaviddTech is an advanced, meticulously engineered trading indicator adhering strictly to the DaviddTech methodology. Rather than simply combining popular indicators, Alpha Wave strategically integrates specially-selected technical components—each optimized to enhance their combined strengths while neutralizing individual weaknesses, providing traders with clear, consistent, and high-probability trading signals.
Valid Setup:
🎯 Why This Combination Matters:
Quantum Adaptive Moving Average (Baseline):
This advanced adaptive MA provides superior responsiveness to market shifts by dynamically adjusting its sensitivity, clearly indicating the primary market direction and reducing lag compared to standard moving averages.
WavePulse Indicator (CoralChannel-based Confirmation #1):
Precisely detects shifts in momentum and price acceleration, allowing traders to anticipate trend continuation or reversals effectively, significantly enhancing trade accuracy.
Quantum Channel (G-Channel-based Confirmation #2):
Dynamically captures price volatility ranges, offering reliable trend structure validation and clear support/resistance channels, further increasing signal reliability.
Momentum Density (Volatility Filter):
Ensures traders enter only during optimal volatility conditions by quantifying momentum intensity, effectively filtering out low-quality, low-momentum scenarios.
Dynamic ATR-based Trailing Stop (Exit System):
Automatically manages trade exits with optimized ATR-based stop levels, systematically securing profits while effectively managing risk.
These meticulously integrated components reinforce each other's strengths, providing traders with a robust, disciplined, and clearly structured approach aligned with the DaviddTech methodology.
🔥 Latest Update – Enhanced BUY & SELL Signals:
Alpha Wave now clearly displays automated BUY and SELL signals directly on your chart, coupled with a comprehensive dashboard table for immediate signal validation. Signals appear only when all components—including baseline, confirmations, and volatility—are in alignment, significantly improving trade accuracy and confidence.
📌 How Traders Benefit from the New Signals:
BUY Signal: Execute long trades when Quantum Adaptive MA signals bullish, confirmed by bullish WavePulse momentum, bullish Quantum Channel structure, and strong Momentum Density readings.
SELL Signal: Clearly marked for entering short positions under bearish market conditions verified through Quantum Adaptive MA, WavePulse bearish momentum, Quantum Channel confirmation, and sufficient Momentum Density.
Signal Validation: A dedicated dashboard provides immediate visual strength metrics, allowing traders to quickly validate signals before execution, significantly enhancing trading discipline and consistency.
📊 Recommended DaviddTech Trading Plan:
Baseline: Determine overall market direction using Quantum Adaptive MA. Only trade in the indicated baseline direction.
Confirmations: Validate potential entries with WavePulse and Quantum Channel alignment.
Volatility Filter: Confirm sufficient market volatility with Momentum Density before entry.
Trailing Stop Loss: Manage risk and secure profits using the dynamic ATR-based trailing stop system.
Entries & Exits: Only execute trades when signals and dashboard components unanimously align.
🖼️ Visual Examples:
Alpha Wave by DaviddTech clearly demonstrates how an intelligently integrated system provides significantly superior trading insights compared to standalone indicators, ensuring precise, disciplined, and profitable market entries and exits across all trading environments.
Support & Resistance + EMA + Swing SL (3 Min)### **📌 Brief Description of the Script**
This **Pine Script indicator** for TradingView displays **Support & Resistance levels, EMAs (21 & 26), and Swing High/Low-based Stop-Loss (SL) points** on a **3-minute timeframe**.
---
### **🔹 Key Features & Functionality**
1️⃣ **🟥 Support & Resistance Calculation:**
- Finds the **highest & lowest price over the last 50 candles**
- Plots **Resistance (Red) & Support (Green) levels**
2️⃣ **📈 EMA (Exponential Moving Averages):**
- **21 EMA (Blue)** and **26 EMA (Orange)** for trend direction
- Helps in identifying bullish or bearish momentum
3️⃣ **📊 Swing High & Swing Low Detection:**
- Identifies **Swing Highs (Higher than last 5 candles) as SL for Short trades**
- Identifies **Swing Lows (Lower than last 5 candles) as SL for Long trades**
- Plots these levels as **Purple (Swing High SL) & Yellow (Swing Low SL) dotted lines**
4️⃣ **📌 Labels on Swing Points:**
- **"HH SL"** is placed on Swing Highs
- **"LL SL"** is placed on Swing Lows
5️⃣ **⚡ Breakout Detection:**
- Detects if **price crosses above Resistance** (Bullish Breakout)
- Detects if **price crosses below Support** (Bearish Breakout)
- Background color changes to **Green (Bullish)** or **Red (Bearish)**
6️⃣ **🚨 Alerts for Breakouts:**
- Sends alerts when **price breaks above Resistance or below Support**
---
### **🎯 How to Use This Indicator?**
- **Trade with Trend:** Follow **EMA crossovers** and Support/Resistance levels
- **Set Stop-Loss:** Use **Swing High as SL for Shorts** & **Swing Low as SL for Longs**
- **Look for Breakouts:** Enter trades when price **crosses Resistance or Support**
This script is **ideal for scalping & intraday trading** in a **3-minute timeframe** 🚀🔥
Let me know if you need **any modifications or improvements!** 📊💹
Pivot Point Calculator PPC V2 by [KhedrFx]📈 Trade Smarter with the Pivot Point Calculator (PPC) by KhedrFx
Want to spot key price levels and make better trading decisions? The Pivot Point Calculator (PPC) by KhedrFx is your go-to TradingView tool for identifying potential support and resistance zones. Whether you’re a Scalper trader, day trader, swing trader, or long-term investor, this script helps you plan precise entries and exits with confidence.
🔹 How to Use Pivot Points in Trading
📊 Step 1: Identify Key Levels
The PPC automatically plots:
Pivot Point (P): The main level where sentiment shifts between bullish and bearish.
Support Levels (S1, S2, S3): Areas where price may bounce higher.
Resistance Levels (R1, R2, R3): Areas where price may face selling pressure.
These levels act as dynamic price zones, helping you anticipate potential market movements.
🔥 Step 2: Choose Your Trading Strategy
1️⃣ Breakout Trading
Buy when the price breaks above the pivot point (P) with strong momentum.
Sell when the price drops below the pivot point (P) with strong momentum.
Use R1, R2, or R3 as profit targets in an uptrend and S1, S2, or S3 in a downtrend.
2️⃣ Reversal (Bounce) Trading
Buy when the price pulls back to S1, S2, or S3 and shows bullish confirmation (e.g., candlestick patterns like a bullish engulfing or hammer).
Sell when the price rallies to R1, R2, or R3 and shows bearish confirmation (e.g., rejection wicks or a bearish engulfing pattern).
🎯 Step 3: Set Smart Stop-Loss & Take-Profit Levels
Stop-Loss: Place it slightly below support (for buy trades) or above resistance (for sell trades).
Take-Profit: Use the next pivot level as a target.
Extreme Zones: R3 and S3 often signal strong reversals or breakouts—watch them closely!
🚀 How to Get Started
1️⃣ Add the PPC script to your TradingView chart.
2️⃣ Choose a timeframe that fits your strategy (5m, 15m, 30m, 1H, 4H, Daily, or Weekly).
3️⃣ Use the pivot points and support/resistance levels to fine-tune your trade entries, exits, and risk management.
⚠️ Trade Responsibly
This tool helps you analyze the market, but it’s not a guarantee of profits. Always do your own research, manage risk, and trade with caution.
💡 Ready to take your trading to the next level? Try the Pivot Point Calculator (PPC) by KhedrFx and start trading with confidence today! 🚀
PVSRA v5Overview of the PVSRA Strategy
This strategy is designed to detect and capitalize on volume-driven threshold breaches in price candles. It operates on the premise that when a high-volume candle breaks a critical price threshold, not all orders are filled within that candle’s range. This creates an imbalance—similar to a physical system being perturbed—causing the price to revert toward the level where the breach occurred to “absorb” the residual orders.
Key Features and Their Theoretical Underpinnings
Dynamic Volume Analysis and Threshold Detection
Volume Surges as Market Perturbations:
The script computes a moving average of volume over a short window and flags moments when the current volume significantly exceeds this average. These surges act as a perturbation—injecting “energy” into the market.
Adaptive Abnormal Volume Threshold:
By calculating a dynamic abnormal threshold using a daily volume average (via an 89-period VWMA) and standard deviation, the strategy identifies when the current volume is abnormally high. This mechanism mirrors the idea that when a system is disturbed (here, by a volume surge), it naturally seeks to return to equilibrium.
Candle Coloring and Visual Signal Identification
Differentiation of Candle Types:
The script distinguishes between bullish (green) and bearish (red) candles. It applies different colors based on the strength of the volume signal, providing a clear, visual representation of whether a candle is likely to trigger a price reversion.
Implication of Unfilled Orders:
A red (bearish) candle with high volume implies that sell pressure has pushed the price past a critical threshold—yet not all buy orders have been fulfilled. Conversely, a green (bullish) candle indicates that aggressive buying has left pending sell orders. In both cases, the market is expected to reverse toward the breach point to restore balance.
Trade Execution Logic: Normal and Reversal Trades
Normal Trades:
When a high-volume candle breaches a threshold and meets the directional conditions (e.g., a red candle paired with price above a daily upper band), the strategy enters a trade anticipating a reversion. The underlying idea is that the market will move back to the level where the threshold was crossed—clearing the residual orders in a manner analogous to a system following the path of least resistance.
Reversal Trades:
The strategy also monitors for clusters of consecutive signals within a short lookback period. When multiple signals accumulate, it interprets this as the market having overextended and, in a corrective move, reverses the typical trade direction. This inversion captures the market’s natural tendency to “correct” itself by moving in discrete, quantized steps—each step representing the absorption of a minimum quantum of order imbalance.
Risk and Trade Management
Stop Loss and Take Profit Buffers:
Both normal and reversal trades include predetermined buffers for stop loss and take profit levels. This systematic risk management approach is designed to capture the anticipated reversion while minimizing potential losses, aligning with the idea that market corrections follow the most energy-efficient path back to equilibrium.
Symbol Flexibility:
An option to override the chart’s symbol allows the strategy to be applied consistently across different markets, ensuring that the volume and price dynamics are analyzed uniformly.
Conceptual Bridge: From Market Dynamics to Trade Execution
At its core, the strategy treats market price movements much like a physical system that seeks to minimize “transactional energy” or inefficiency. When a price candle breaches a key threshold on high volume, it mimics an injection of energy into the system. The subsequent price reversion is the market’s natural response—moving in the most efficient path back to balance. This perspective is akin to the principle of least action, where the system evolves along the trajectory that minimizes cumulative imbalance, and it acknowledges that these corrections occur in discrete steps reflective of quantized order execution.
This unified framework allows the PVSRA strategy to not only identify when significant volume-based threshold breaches occur but also to systematically execute trades that benefit from the expected corrective moves.
Liquidity Sweep Filter Strategy [AlgoAlpha X PineIndicators]This strategy is based on the Liquidity Sweep Filter developed by AlgoAlpha. Full credit for the concept and original indicator goes to AlgoAlpha.
The Liquidity Sweep Filter Strategy is a non-repainting trading system designed to identify liquidity sweeps, trend shifts, and high-impact price levels. It incorporates volume-based liquidation analysis, trend confirmation, and dynamic support/resistance detection to optimize trade entries and exits.
This strategy helps traders:
Detect liquidity sweeps where major market participants trigger stop losses and liquidations.
Identify trend shifts using a volatility-based moving average system.
Analyze volume distribution with a built-in volume profile visualization.
Filter noise by differentiating between major and minor liquidity sweeps.
How the Liquidity Sweep Filter Strategy Works
1. Trend Detection Using Volatility-Based Filtering
The strategy applies a volatility-adjusted moving average system to determine trend direction:
A central trend line is calculated using an EMA smoothed over a user-defined length.
Upper and lower deviation bands are created based on the average price deviation over multiple periods.
If price closes above the upper band, the strategy signals an uptrend.
If price closes below the lower band, the strategy signals a downtrend.
This approach ensures that trend shifts are confirmed only when price significantly moves beyond normal market fluctuations.
2. Liquidity Sweep Detection
Liquidity sweeps occur when price temporarily breaks key levels, triggering stop-loss liquidations or margin call events. The strategy tracks swing highs and lows, marking potential liquidity grabs:
Bearish Liquidity Sweeps – Price breaks a recent high, then reverses downward.
Bullish Liquidity Sweeps – Price breaks a recent low, then reverses upward.
Volume Integration – The strategy analyzes trading volume at each sweep to differentiate between major and minor sweeps.
Key levels where liquidity sweeps occur are plotted as color-coded horizontal lines:
Red lines indicate bearish liquidity sweeps.
Green lines indicate bullish liquidity sweeps.
Labels are displayed at each sweep, showing the volume of liquidated positions at that level.
3. Volume Profile Analysis
The strategy includes an optional volume profile visualization, displaying how trading volume is distributed across different price levels.
Features of the volume profile:
Point of Control (POC) – The price level with the highest traded volume is marked as a key area of interest.
Bounding Box – The profile is enclosed within a transparent box, helping traders visualize the price range of high trading activity.
Customizable Resolution & Scale – Traders can adjust the granularity of the profile to match their preferred time frame.
The volume profile helps identify zones of strong support and resistance, making it easier to anticipate price reactions at key levels.
Trade Entry & Exit Conditions
The strategy allows traders to configure trade direction:
Long Only – Only takes long trades.
Short Only – Only takes short trades.
Long & Short – Trades in both directions.
Entry Conditions
Long Entry:
A bullish trend shift is confirmed.
A bullish liquidity sweep occurs (price sweeps below a key level and reverses).
The trade direction setting allows long trades.
Short Entry:
A bearish trend shift is confirmed.
A bearish liquidity sweep occurs (price sweeps above a key level and reverses).
The trade direction setting allows short trades.
Exit Conditions
Closing a Long Position:
A bearish trend shift occurs.
The position is liquidated at a predefined liquidity sweep level.
Closing a Short Position:
A bullish trend shift occurs.
The position is liquidated at a predefined liquidity sweep level.
Customization Options
The strategy offers multiple adjustable settings:
Trade Mode: Choose between Long Only, Short Only, or Long & Short.
Trend Calculation Length & Multiplier: Adjust how trend signals are calculated.
Liquidity Sweep Sensitivity: Customize how aggressively the strategy identifies sweeps.
Volume Profile Display: Enable or disable the volume profile visualization.
Bounding Box & Scaling: Control the size and position of the volume profile.
Color Customization: Adjust colors for bullish and bearish signals.
Considerations & Limitations
Liquidity sweeps do not always result in reversals. Some price sweeps may continue in the same direction.
Works best in volatile markets. In low-volatility environments, liquidity sweeps may be less reliable.
Trend confirmation adds a slight delay. The strategy ensures valid signals, but this may result in slightly later entries.
Large volume imbalances may distort the volume profile. Adjusting the scale settings can help improve visualization.
Conclusion
The Liquidity Sweep Filter Strategy is a volume-integrated trading system that combines liquidity sweeps, trend analysis, and volume profile data to optimize trade execution.
By identifying key price levels where liquidations occur, this strategy provides valuable insight into market behavior, helping traders make better-informed trading decisions.
Key use cases for this strategy:
Liquidity-Based Trading – Capturing moves triggered by stop hunts and liquidations.
Volume Analysis – Using volume profile data to confirm high-activity price zones.
Trend Following – Entering trades based on confirmed trend shifts.
Support & Resistance Trading – Using liquidity sweep levels as dynamic price zones.
This strategy is fully customizable, allowing traders to adapt it to different market conditions, timeframes, and risk preferences.
Full credit for the original concept and indicator goes to AlgoAlpha.
NSE Index Strategy with Entry/Exit MarkersExplanation of the Code
Trend Filter (200 SMA):
The line trendSMA = ta.sma(close, smaPeriod) calculates the 200‑period simple moving average. By trading only when the current price is above this SMA (inUptrend = close > trendSMA), we aim to trade in the direction of the dominant trend.
RSI Entry Signal:
The RSI is calculated with rsiValue = ta.rsi(close, rsiPeriod). The script checks for an RSI crossover above the oversold threshold using ta.crossover(rsiValue, rsiOversold). This helps capture a potential reversal from a minor pullback in an uptrend.
ATR-Based Exits:
ATR is computed by atrValue = ta.atr(atrPeriod) and is used to set the stop loss and take profit levels:
Stop Loss: stopLossPrice = close - atrMultiplier * atrValue
Take Profit: takeProfitPrice = close + atrMultiplier * atrValue
This dynamic approach allows the exit levels to adjust according to the current market volatility.
Risk and Money Management:
The strategy uses a fixed percentage of equity (10% by default) for each trade. The built‑in commission parameter helps simulate real-world trading costs.
Trading Sessions Highs/Lows | InvrsROBINHOODTrading Sessions Highs/Lows | InvrsROBINHOOD
🚀 A powerful indicator for tracking key trading sessions and the highs and lows of each session!
📌 Description
The Trading Sessions Highs/Lows indicator visually marks the most critical trading sessions—Asia, London, and New York—using small colored dots at the bottom of the candle. It also tracks and plots the highs and lows of each session, along with the Daily Open and Weekly Open levels.
This tool is designed to help traders identify session-based liquidity zones, price reactions, and potential trade setups with minimal chart clutter.
Key Features:
✅ Session markers (Asia, London, NY AM, NY Lunch, NY PM) plotted as small dots
✅ Plots session highs and lows for market structure insights
✅ Daily Open line for intraday reference
✅ Weekly Open line for higher timeframe bias
✅ Alerts for session high/low breaks to capture momentum shifts
✅ User-defined UTC offset for global traders
✅ Customizable session colors for personal preference
📖 How to Use the Indicator
1️⃣ Understanding the Sessions
Asia Session (Yellow Dot) → Marks liquidity buildup & pre-London moves
London Session (Blue Dot) → Strong volatility, breakout opportunities
New York AM Session (Green Dot) → Major trends & institutional participation
New York Lunch (Red Dot) → Low volume, ranging market
New York PM Session (Dark Green Dot) → End-of-day movements & reversals
2️⃣ Session Highs & Lows for Market Structure
Session Highs can act as resistance or breakout points.
Session Lows can act as support or stop-hunt zones.
Break of a session high/low with volume may indicate continuation or reversal.
3️⃣ Using the Daily & Weekly Open
The Daily Open (Black Line) helps gauge the intraday trend.
Above Daily Open → Bearish Bias
Below Daily Open → Bullish Bias
The Weekly Open (Red Line) sets the higher timeframe directional bias.
4️⃣ Alerts for Breakouts
The indicator will trigger alerts when price breaks session highs or lows.
Useful for setting stop-losses, breakout trades, and risk management.
💡 Why This Indicator is Important for Beginners
1️⃣ Avoids Overtrading:
Many beginners trade in low-volume periods (NY Lunch, Asia session) and get stuck in choppy price action.
This indicator highlights when volatility is high so traders focus on better opportunities.
2️⃣ Session-Based Liquidity Traps:
Market makers often run stops at session highs/lows before reversing.
Watching session breaks prevents traders from falling into liquidity grabs.
3️⃣ Reduces Emotional Trading:
If price is above the Daily Open, a beginner shouldn’t look for shorts.
If price is below a key session low, it may signal a fake breakout.
4️⃣ Aligns with Institutional Trading:
Smart money traders use session highs/lows to set stop hunts & reversals.
Beginners can use this indicator to spot these zones before entering trades.
🛡️ How to Mitigate Risk with This Indicator
✅ Wait for Confirmations – Don’t trade blindly at session highs/lows. Look for wicks, rejections, or break/retests.
✅ Use Stop-Loss Above/Below Session Levels – If you’re going long, set SL below a session low. If short, set SL above a session high.
✅ Watch Volume & News Events – Breakouts without strong volume or news may be fake moves.
✅ Combine with Other Strategies – Use price action, trendlines, or EMAs with this indicator for higher probability trades.
✅ Use the Weekly Open for Trend Bias – If price stays below the Weekly Open, avoid bullish setups unless key support holds.
🎯 Who is This Indicator For?
📌 Beginners who need clear session-based trading levels.
📌 Day traders & scalpers looking to refine their intraday setups.
📌 Smart money traders using liquidity concepts.
📌 Swing traders tracking higher timeframe momentum shifts.
🚀 Final Thoughts
This indicator is an essential tool for traders who want to understand market structure, liquidity, and volatility cycles. Whether you’re trading forex, stocks, or crypto, it helps you stay on the right side of the market and avoid unnecessary risks.
🔹 Set it up, customize your colors, define your UTC offset, and start trading smarter today! 🏆📈
EMA Crossover Backtest [BarScripts]This indicator lets you backtest an EMA crossover strategy with built-in risk management and trade tracking. It simulates long and short trades based on EMA crossovers, allowing you to fine-tune entry conditions, stop-loss placement, and reward/risk settings.
🔹 How It Works:
Long Entry: Fast EMA crosses above Slow EMA, and price closes above Fast EMA.
Short Entry: Fast EMA crosses below Slow EMA, and price closes below Fast EMA.
Stop Loss: Set based on previous bars or a fixed amount.
Take Profit: Adjustable reward/risk ratio.
Higher Timeframe Confluence: Confirms trades based on a larger timeframe.
Trade Hours Filter: Limits trades to specific time windows.
🔹 Key Features:
✅ Shows Entry & Exit Points with visual trade lines.
✅ Customizable EMA Lengths to fit any strategy.
✅ P&L Tracking & Statistics to measure performance.
✅ Position Sizing Options: Fixed position, fixed risk, or percentage of balance.
✅ Commissions Tracking (based on total trades, not contracts).
Use this tool to fine-tune your EMA crossover strategy and see how it performs over time! 🚀
💬 Let me know your feedback—suggest improvements, report issues, or request new features!
Discount/Premium OTE LevelsThis indicator is created to identify discount/premium areas to provide additional confluence to trades taken. The underlying theory is that the trades taken in discounted areas are likely to have less risk due to a smaller stop loss and a higher reward/risk ratio.
The indicator operates by first identifying a zone between the last major swing high and low. These highs and lows are determined as price points that at the extremes within the number of bars to the left, as defined by the "Swing Sensitivity" setting.
Once a price zone is established, the indicator verifies that the zone meets the minimum size in points as configured via the "Minimum size" setting to be considered tradable. Zones that are too small may not provide a sufficient range even for scalping. The default value is 42 points based on Nasdaq, which means that the distance between inner most OTE levels (0.382 and 0.618) is at least 10 points.
When a valid zone is identified, it is then subdivided into areas of interest based on OTE levels, which can be configured/adjusted via the "Levels to Draw" setting. These levels represent the midpoint (50%), which distinguishes between premium and discount, and the three OTE levels 0.79, 0.705, 0.618, above the 50% for discount and below the 50% for premium.
For example, if a zone is formed initially by a swing low followed by a swing high with the assumption that the draw is higher, the indicator can be used to formulate long positions from below the 50% level starting at 0.38 OTE level, or ideally at 0.295 OTE level using 0 as a stop loss. Alternatively, if the 50% level is not yet tapped, short scalp positions can be made from 0.79-0.618 OTE levels with 50% as a partial or TP target.
See for long/short example
Typically, the indicator will show only a single zone. However, there may be cases with two zones: one larger parent zone containing a smaller, valid price zone within itself.
The indicator will automatically invalidate and remove the zone once the high/low of the zone is invalidated.
Configuration:
The indicator provides several visualization options for customization, including:
Color settings for OTE levels, with separate settings for edge/50% color, premium, and discount levels.
Settings for line style for OTE levels.
Settings to determine whether to show prices on level labels.
Settings to decide if lines should be extended to the right.
Advanced Multi-Timeframe Trading System (Risk Managed)Description:
This strategy is an original approach that combines two main analytical components to identify potential trade opportunities while simulating realistic trading conditions:
1. Market Trend Analysis via an Approximate Hurst Exponent
• What It Does:
The strategy computes a rough measure of market trending using an approximate Hurst exponent. A value above 0.5 suggests persistent, trending behavior, while a value below 0.5 indicates a tendency toward mean-reversion.
• How It’s Used:
The Hurst exponent is calculated on both the chart’s current timeframe and a higher timeframe (default: Daily) to capture both local and broader market dynamics.
2. Fibonacci Retracement Levels
• What It Does:
Using daily high and low data from a selected timeframe (default: Daily), the script computes key Fibonacci retracement levels.
• How It’s Used:
• The 61.8% level (Golden Ratio) serves as a key threshold:
• A long entry is signaled when the price crosses above this level if the daily Hurst exponent confirms a trending market.
• The 38.2% level is used to identify short-entry opportunities when the price crosses below it and the daily Hurst indicates non-trending conditions.
Signal Logic:
• Long Entry:
When the price crosses above the 61.8% Fibonacci level (Golden Ratio) and the daily Hurst exponent is greater than 0.5, suggesting a trending market.
• Short Entry:
When the price crosses below the 38.2% Fibonacci level and the daily Hurst exponent is less than 0.5, indicating a less trending or potentially reversing market.
Risk Management & Trade Execution:
• Stop-Loss:
Each trade is risk-managed with a stop-loss set at 2% below (for longs) or above (for shorts) the entry price. This ensures that no single trade risks more than a small, sustainable portion of the account.
• Take Profit:
A take profit order targets a risk-reward ratio of 1:2 (i.e., the target profit is twice the amount risked).
• Position Sizing:
Trades are executed with a fixed position size equal to 10% of account equity.
• Trade Frequency Limits:
• Daily Limit: A maximum of 5 trades per day
• Overall Limit: No more than 510 trades during the backtesting period (e.g., since 2019)
These limits are imposed to simulate realistic trading frequency and to avoid overtrading in backtest results.
Backtesting Parameters:
• Initial Capital: $10,000
• Commission: 0.1% per trade
• Slippage: 1 tick per bar
These settings aim to reflect the conditions faced by the average trader and help ensure that the backtesting results are realistic and not misleading.
Chart Overlays & Visual Aids:
• Fibonacci Levels:
The key Fibonacci retracement levels are plotted on the chart, and the zone between the 61.8% and 38.2% levels is highlighted to show a key retracement area.
• Market Trend Background:
The chart background is tinted green when the daily Hurst exponent indicates a trending market (value > 0.5) and red otherwise.
• Information Table:
An on-chart table displays key parameters such as the current Hurst exponent, daily Hurst value, the number of trades executed today, and the global trade count.
Disclaimer:
Past performance is not indicative of future results. This strategy is experimental and provided solely for educational purposes. It is essential that you backtest and paper trade using your own settings before considering any live deployment. The Hurst exponent calculation is an approximation and should be interpreted as a rough gauge of market behavior. Adjust the parameters and risk management settings according to your personal risk tolerance and market conditions.
Additional Notes:
• Originality & Usefulness:
This script is an original mashup that combines trend analysis with Fibonacci retracement methods. The description above explains how these components work together to provide trading signals.
• Realistic Results:
The strategy uses realistic account sizes, commission rates, slippage, and risk management rules to generate backtesting results that are representative of real-world trading.
• Educational Purpose:
This script is intended to support the TradingView community by offering insights into combining multiple analysis techniques in one strategy. It is not a “get-rich-quick” system but rather an educational tool to help traders understand risk management and trade signal logic.
By using this script, you acknowledge that trading involves risk and that you are responsible for testing and adjusting the strategy to fit your own trading environment. This publication is fully open source, and any modifications should include proper attribution if significant portions of the code are reused.
High-Probability IndicatorExplanation of the Code
Trend Filter (EMA):
A 50-period Exponential Moving Average (EMA) is used to determine the overall trend.
trendUp is true when the price is above the EMA.
trendDown is true when the price is below the EMA.
Momentum Filter (RSI):
A 14-period RSI is used to identify overbought and oversold conditions.
oversold is true when RSI ≤ 30.
overbought is true when RSI ≥ 70.
Volatility Filter (ATR):
A 14-period Average True Range (ATR) is used to measure volatility.
ATR is multiplied by a user-defined multiplier (default: 2.0) to set a volatility threshold.
Ensures trades are only taken during periods of sufficient volatility.
Entry Conditions:
Long Entry: Price is above the EMA (uptrend), RSI is oversold, and the candle range exceeds the ATR threshold.
Short Entry: Price is below the EMA (downtrend), RSI is overbought, and the candle range exceeds the ATR threshold.
Exit Conditions:
Take Profit: A fixed percentage above/below the entry price.
Stop Loss: A fixed percentage below/above the entry price.
Visualization:
The EMA is plotted on the chart.
Background colors highlight uptrends and downtrends.
Buy and sell signals are displayed as labels on the chart.
Alerts:
Alerts are triggered for buy and sell signals.
How to Use the Indicator
Trend Filter:
Only take trades in the direction of the trend (e.g., long in an uptrend, short in a downtrend).
Momentum Filter:
Look for oversold conditions in an uptrend for long entries.
Look for overbought conditions in a downtrend for short entries.
Volatility Filter:
Ensure the candle range exceeds the ATR threshold to avoid low-volatility trades.
Risk Management:
Use the built-in take profit and stop loss levels to manage risk.
Optimization Tips
Backtesting:
Test the indicator on multiple timeframes and assets to evaluate its performance.
Adjust the input parameters (e.g., EMA length, RSI length, ATR multiplier) to optimize for specific markets.
Combination with Other Strategies:
Add additional filters, such as volume analysis or support/resistance levels, to improve accuracy.
Risk Management:
Use proper position sizing and risk-reward ratios to maximize profitability.
Disclaimer
No indicator can guarantee an 85% win ratio due to the inherent unpredictability of financial markets. This script is provided for educational purposes only. Always conduct thorough backtesting and paper trading before using any strategy in live trading.
Let me know if you need further assistance or enhancements!
Daily COC Strategy with SHERLOCK WAVESThis indicator implements a unique trading strategy known as the "Daily COC (Candle Over Candle) Strategy" enhanced with "SHERLOCK WAVES" for pattern recognition. It's designed for traders looking to capitalize on specific candlestick formations with a negative risk-reward ratio, with the aim of achieving a high win rate (over 70%) through numerous trading opportunities, despite each trade having a higher risk relative to the reward.
Key Features:
Pattern Recognition: Identifies a setup based on three consecutive candles - a red candle followed by a shooting star, then an entry candle that does not break below the shooting star's low.
Negative Risk/Reward Trade Selection: Focuses on entries where the potential stop loss is greater than the take profit, banking on a high win rate to offset the individual trade's negative risk-reward ratio.
Visual Signals:
Green Label: Marks potential entry points at the high of the candle before the entry.
Green Dot: Indicates a winning trade closure.
Red Dot: Signals a losing trade closure.
Blue Circle: Warns when the current candle is within 2% of breaking above the previous candle's high, suggesting a potential setup is developing.
Green Circle: Plots the take profit level.
Red Circle: Plots the stop loss level.
Dynamic Statistics: A live updating label showing the number of trades, wins, losses, open trades, current account balance, and win percentage.
Customizable Parameters:
Risk % per Trade: Adjust the percentage of your account balance you're willing to risk on each trade.
Initial Account Balance: Set your starting balance for tracking performance.
Start Date for Strategy: Define when the strategy should start calculating from, allowing for backtesting.
Alerts:
An alert condition is set for when a potential trade setup is developing, helping traders prepare for entries.
Usage Tips:
This strategy is predicated on the idea that a high win rate can compensate for the negative risk-reward ratio of individual trades. It might not suit all market conditions or traders' risk profiles.
Use this strategy in conjunction with other analysis methods to validate trade setups.
Note: Always backtest thoroughly before applying to live markets. Consider this tool as part of a broader trading strategy, not a standalone solution. Monitor your win rate and adjust your risk management accordingly to ensure the strategy remains profitable over time.
This description now correctly explains the purpose behind the negative risk-reward ratio in the context of your trading strategy.
Channels by SmanovIndicator Description
“Channels by Smanov” is a multi-channel indicator that plots dynamic support and resistance zones around a moving average line. It is composed of two main parts:
FL 1 (Flexible Channels):
A Simple Moving Average (SMA) serves as the Basis.
Upper and lower bands are calculated by adding and subtracting an ATR-based buffer from the Basis.
User-defined inputs (such as Half Length, ATR Period, and ATR Multiplier) allow for flexibility in adapting the channel width to different market conditions.
FL 2 (Fixed Channels):
Eight additional bands expand on the same SMA + ATR logic but use fixed ATR multipliers (ranging from 2.2 up to 5.0).
These extra lines can help you gauge more distant levels of potential support or resistance.
By combining an SMA (to smooth price data) with ATR (to gauge volatility), this indicator highlights areas where price may be “stretched” relative to recent volatility. Traders often use channel-based indicators to identify potential “overbought” or “oversold” conditions, as well as to spot trend continuations or reversals.
How to Use / Trading Strategy
Trend Identification (Basis Line):
The middle line (the SMA) can be used as a trend filter:
If price consistently stays above the basis, it suggests an uptrend.
If price consistently stays below the basis, it suggests a downtrend.
Reversal Opportunities (Outer Bands):
When price moves into or beyond the upper bands, it may signal overbought conditions, creating potential short (or profit-taking) opportunities.
Conversely, when price dips into or beyond the lower bands, it may signal oversold conditions, which some traders use for initiating or adding to long positions.
Breakout or Continuation Signals:
In a strong trend, price may “ride” along the outer channels.
A clear break above/below a channel that previously acted as resistance/support could hint at trend continuation.
Failure to break these levels could suggest a potential reversal or consolidation phase.
Stop-Loss Placement:
Traders often place stops just outside a relevant band. For example, if you go long on a dip near a lower band, you might place your stop slightly below that band, relying on the ATR-based buffer to reflect normal volatility.
Multiple Timeframe Analysis:
Consider confirming signals on a higher timeframe (e.g., 4-hour or daily) while taking entries on a lower timeframe.
Channels on higher timeframes can act as stronger support or resistance, offering additional confluence.
Disclaimer
This indicator is provided for educational purposes and does not guarantee specific results. Trading involves risk, and individual traders are responsible for managing their own risk and capital. Always conduct thorough analysis and use appropriate risk management (e.g., stop-losses) when entering any market positions.
Enjoy using Channels by Smanov! Your feedback and personal insights can further refine the indicator’s settings for your preferred trading style. Good luck and trade responsibly!
This Pine Script™ code is subject to the terms of the Mozilla Public License 2.0.
© Smanov_I
200 EMA Breakout & Retest Strategy200 EMA Breakout & Retest Strategy
This script is designed for traders who rely on the 200 EMA as a key indicator for trend direction and trade setups. The strategy identifies potential buy and sell opportunities based on breakouts and subsequent retests of the 200 EMA.
How It Works
EMA Breakout Detection:
The script monitors when the price crosses and closes above or below the 200 EMA.
No signal is generated immediately upon the breakout.
Retest Confirmation:
After the breakout, the price must retrace to touch the 200 EMA.
A valid signal occurs only when the price touches the EMA and the candle closes above (for buy) or below (for sell).
Trade Signal Generation:
Once the retest is confirmed:
A Buy Signal is generated if the price closes above the 200 EMA after the retest.
A Sell Signal is generated if the price closes below the 200 EMA after the retest.
The script calculates:
Stop Loss: Placed at the low of the candle for a buy signal and at the high of the candle for a sell signal.
Take Profit: Based on a customizable Risk-Reward Ratio (default is 1:2).
Visual Indicators:
The 200 EMA is plotted on the chart for reference.
Buy/Sell signals are displayed as labels on the chart.
Stop loss and take profit levels are drawn using dotted lines.
Customization Options
EMA Length: Adjustable (default is 200).
Risk-Reward Ratio: Customizable to suit different trading styles.
Who Is This For?
This strategy is ideal for traders who:
Prefer trading with the trend using EMA-based strategies.
Look for precise entry points with confirmation from retests.
Require automated calculation of risk-reward levels.
HOD/LOD/PMH/PML/PDH/PDL Strategy by @tradingbauhaus This script is a trading strategy @tradingbauhaus designed to trade based on key price levels, such as the High of Day (HOD), Low of Day (LOD), Premarket High (PMH), Premarket Low (PML), Previous Day High (PDH), and Previous Day Low (PDL). Below, I’ll explain in detail what the script does:
Core Functionality of the Script:
Calculates Key Price Levels:
HOD (High of Day): The highest price of the current day.
LOD (Low of Day): The lowest price of the current day.
PMH (Premarket High): The highest price during the premarket session (before the market opens).
PML (Premarket Low): The lowest price during the premarket session.
PDH (Previous Day High): The highest price of the previous day.
PDL (Previous Day Low): The lowest price of the previous day.
Draws Horizontal Lines on the Chart:
Plots horizontal lines on the chart for each key level (HOD, LOD, PMH, PML, PDH, PDL) with specific colors for easy visual identification.
Defines Entry and Exit Rules:
Long Entry (Buy): If the price crosses above the PMH (Premarket High) or the PDH (Previous Day High).
Short Entry (Sell): If the price crosses below the PML (Premarket Low) or the PDL (Previous Day Low).
Long Exit: If the price reaches the HOD (High of Day) during a long position.
Short Exit: If the price reaches the LOD (Low of Day) during a short position.
How the Script Works Step by Step:
Calculates Key Levels:
Uses the request.security function to fetch the HOD and LOD of the current day, as well as the highs and lows of the previous day (PDH and PDL).
Calculates the PMH and PML during the premarket session (before 9:30 AM).
Plots Levels on the Chart:
Uses the plot function to draw horizontal lines on the chart representing the key levels (HOD, LOD, PMH, PML, PDH, PDL).
Each level has a specific color for easy identification:
HOD: White.
LOD: Purple.
PDH: Orange.
PDL: Blue.
PMH: Green.
PML: Red.
Defines Trading Rules:
Uses conditions with ta.crossover and ta.crossunder to detect when the price crosses key levels.
Long Entry: If the price crosses above the PMH or PDH, a long position (buy) is opened.
Short Entry: If the price crosses below the PML or PDL, a short position (sell) is opened.
Long Exit: If the price reaches the HOD during a long position, the position is closed.
Short Exit: If the price reaches the LOD during a short position, the position is closed.
Executes Orders Automatically:
Uses the strategy.entry and strategy.close functions to open and close positions automatically based on the defined rules.
Advantages of This Strategy:
Based on Key Levels: Uses important price levels that often act as support and resistance.
Easy to Visualize: Horizontal lines on the chart make it easy to identify levels.
Automated: Entries and exits are executed automatically based on the defined rules.
Limitations of This Strategy:
Dependent on Volatility: Works best in markets with significant price movements.
False Crosses: There may be false crosses that generate incorrect signals.
No Advanced Risk Management: Does not include dynamic stop-loss or take-profit mechanisms.
How to Improve the Strategy:
Add Stop-Loss and Take-Profit: To limit losses and lock in profits.
Filter Signals with Indicators: Use RSI, MACD, or other indicators to confirm signals.
Optimize Levels: Adjust key levels based on the asset’s behavior.
In summary, this script is a trading strategy that operates based on key price levels, such as HOD, LOD, PMH, PML, PDH, and PDL. It is useful for traders who want to trade based on significant support and resistance levels.
Trend Trading SetupTrend Trading Setup is an indicator that is designed to assist with trend trading by indicating when the basic conditions for a trade in either direction are met.
Note: Default values assume the 1-hour chart
The idea is that this will allow a trader to know for the first glance if a market is worthy of closer inspection or not.
Indicator Features:
1. Simple Moving Averages - defining the basic trade conditions
5 - Day Moving Average
20 - Day Moving Average
50 - Day Moving Average
2. Visualisation of The Price Location In Relation To The 5 - Day Moving Average
If price is above the 5-day Moving Average, the space between them is green. If price is below the 5-day Moving Average, the space between them is red.
3. Risk Management Section - calculates an ATR-based stop loss.
4. Indication When The Conditions Are Met
If the conditions for a bullish bias are met, the chart background is green. If the conditions for a bearish bias are met, the chart background is red. If none of the conditions are met, the chart background is left as is.
A user can adjust the length of any of the Moving Averages as well as the length of the ATR and the ATR Multiplier for the stop loss size. Default values assume the 1-hour chart, but surprisingly the settings seem to show logical results also on other time frames.
The Setup:
Bullish - 5-day Moving Average is above the 50-day Moving Average. The slope of both of the Moving Averages is positive and the price has to be above the 5-day Moving Average.
Bearish - Exactly the same as for the bullish bias, but opposite.
I do not recommend to take this Trend Trading Setup indicator as the only reason for a position. However, I believe it can be very useful to show when the overall conditions are in favour of a long position or in favour of a short position.
DemaRSI StrategyThis is a repost to a old script that cant be updated anymore, the request was made on Feb, 27, 2016.
Here's a engaging description for the tradingview script:
**DemaRSI Strategy: A Proven Trading System**
Join thousands of traders who have already experienced the power of this highly effective strategy. The DemaRSI system combines two powerful indicators - DEMA (Double Exponential Moving Average) and RSI (Relative Strength Index) - to generate profitable trades with minimal risk.
**Key Features:**
* **Trend-Following**: Our algorithm identifies strong trends using a combination of DEMA and RSI, allowing you to ride the waves of market momentum.
* **Risk Management**: The system includes built-in stop-loss and take-profit levels, ensuring that your gains are protected and losses are minimized.
* **Session-Based Trading**: Trade during specific sessions only (e.g., London or New York) for even more targeted results.
* **Customizable Settings**: Adjust the length of moving averages, RSI periods, and other parameters to suit your trading style.
**What You'll Get:**
* A comprehensive strategy that can be used with any broker or platform
* Easy-to-use interface with customizable settings
* Real-time performance metrics and backtesting capabilities
**Start Trading Like a Pro Today!**
This script is designed for intermediate to advanced traders who want to take their trading game to the next level. With its robust risk management features, this strategy can help you achieve consistent profits in various market conditions.
**Disclaimer:** This script is not intended as investment advice and should be used at your own discretion. Trading carries inherent risks, and losses are possible.
~Llama3